Summer Updates - Round One
The first round of Summer Updates are now live, and it’s one of the biggest visual and usability upgrades so far!
Living Weather Interface
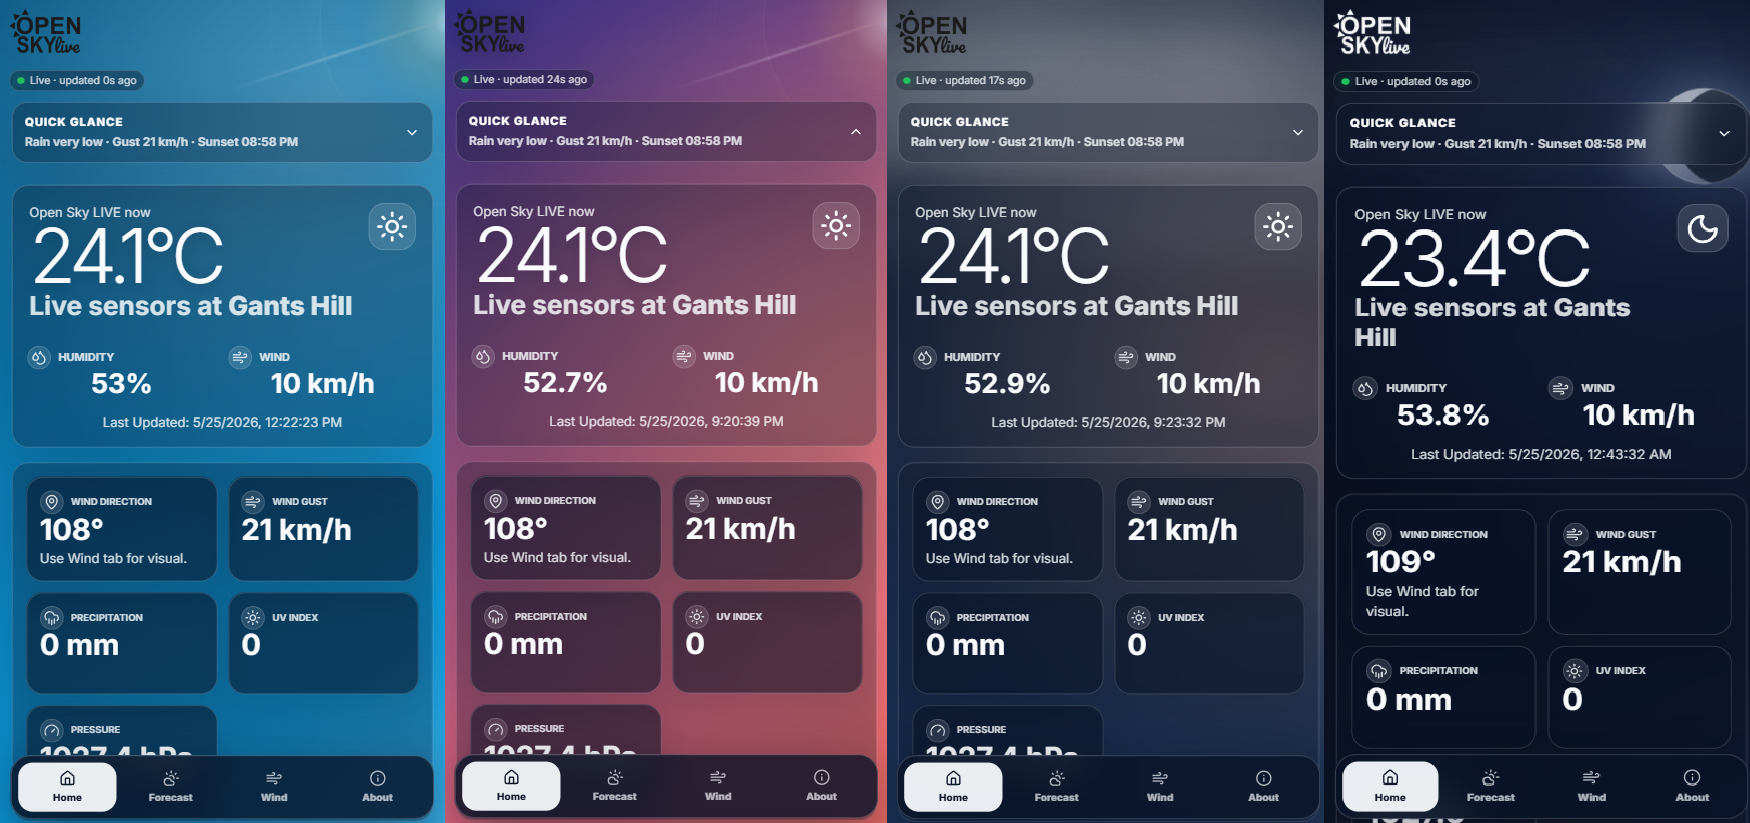
The biggest visual change is the new Weather UI
Open Sky LIVE now reacts to the time of day and current conditions. The background no longer stays fixed. It changes through the day, with bright daytime blues, warmer sunset colours and deep blue night-time sky.
The site now uses local sunrise and sunset timing for the Gants Hill / London area from Open Meteo calculated through our API
During clear or hot weather, the interface can show a warmer sky effect. At night, the brighter daytime effects are removed so the moon becomes the focus. Rain and cloudy conditions also have a softer, moodier feel.
Sunrise, sunset and moon phase
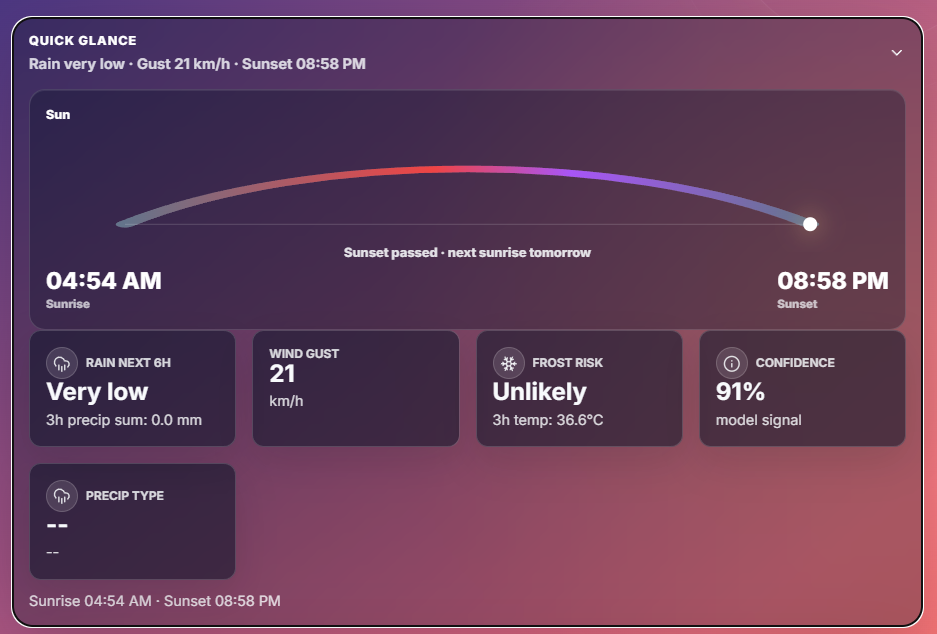
Quick Glance now includes a more visual sun tracker inspired by modern weather apps.
The API now returns local sunrise and sunset data, along with moon phase information. At night, Open Sky LIVE can show a larger atmospheric moon scene using the current moon phase.
Weather Story comes to the homepage
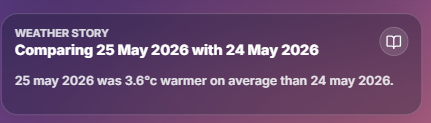
Weather Story is now becoming a core part of Open Sky LIVE.
It now appears on the homepage as a plain-English summary of what is happening locally. Instead of only showing raw values, the site can now explain the weather in a more human way.
For example, it can describe whether the day has been warmer, calmer, wetter, drier or more settled than another period.
Weather Story also appears in the Forecast area above the History Explorer, so users get a readable explanation before diving into the data.
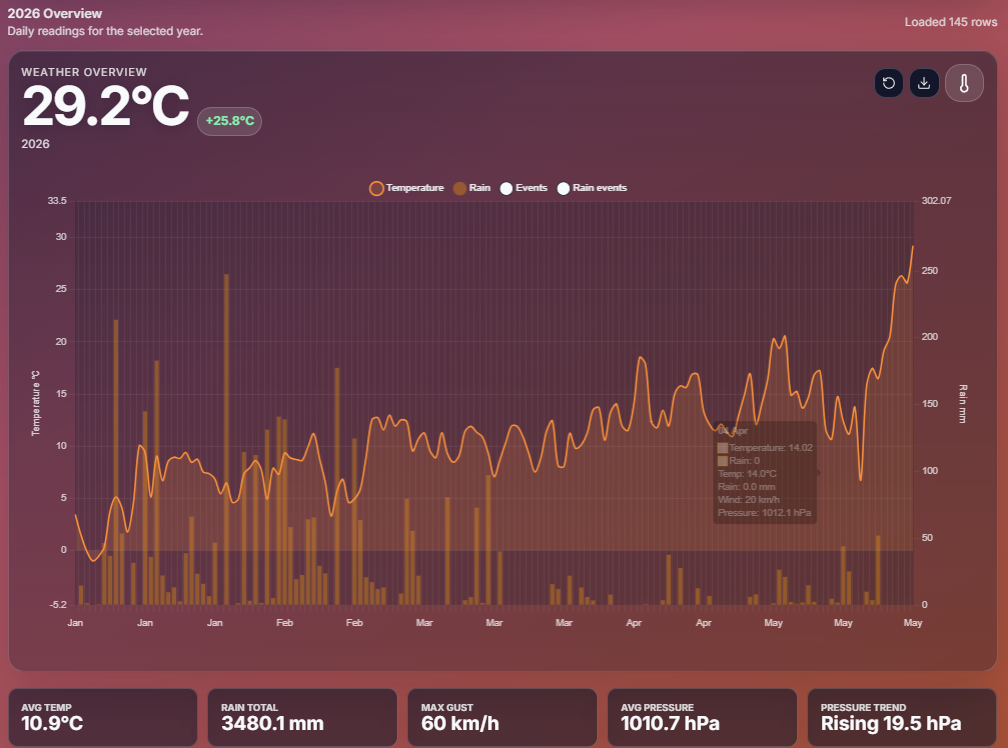
History Explore Improvements
The history explorer has had a lot of work in this update.
For the past 5 months the SkyBox weather station has been collecting and saving its data into a SQLite DB but the website had no way of showing this past data until now.
The graph was based on the Google Finance stock graphs.
The history tools now support:
-
Today, Day, Month and Year views
-
Temperature, Rain, Wind, Pressure and Humidity graphs
-
Explore, Compare and Story modes
-
clearer event markers
-
better chart tooltips
-
CSV export
-
selected-point details
-
static and variable chart scaling
For users who want more, there is now a Simple / Detailed toggle which shows more data points.
Month view can show daily summaries or hourly readings. Year view can show monthly summaries or daily readings.
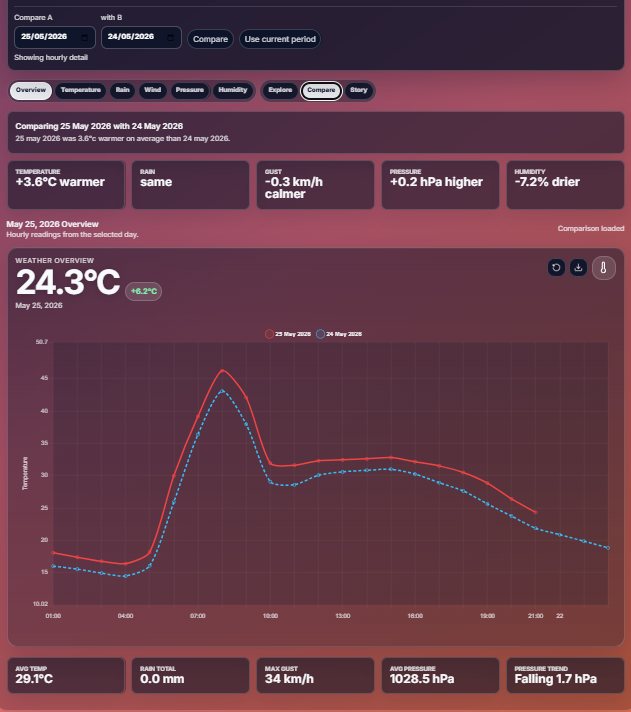
Compare Mode
A new feature which allows users to compare one day, month or year with another.
The Weather Story also reacts to comparisons. Instead of only describing one period, it can explain what changed between the two selected periods.
For example, it can say one day was warmer, drier, windier, more humid or more settled than another.
Better Use of Icons
Open Sky LIVE now uses proper SVG icons instead of emoji-style weather symbols.
This gives the site a cleaner and more consistent look across devices.
A cleaner mobile experience
Mobile usability has had a major pass.
The homepage has been simplified so the current weather is the main focus again. The live weather card now takes priority, with secondary readings placed underneath instead of being squeezed into awkward side-by-side layouts.
The bottom mobile navigation has also been redesigned to feel more like an app. It now uses clearer icons and larger tap targets for:
Home · Forecast · Wind · About
Through analytics most people use OSL through phones so mobile first design will be going ahead.
Data, icons and attribution
Open Sky LIVE combines local SkyBox sensor readings with selected external weather data to provide context for local conditions.
External forecast and astronomy data is supported by Open-Meteo, including sunrise and sunset information. Open-Meteo’s free API requires attribution for non-commercial use under its data licence, so credit is included here.
The interface icons are provided by Lucide, an open-source SVG icon library. Lucide icons are licensed under the MIT License.
Charts and graph rendering use Chart.js, an open-source charting library licensed under the MIT License.
Open Sky LIVE remains its own local weather project. These tools and data sources help power parts of the interface, but the design, local sensor system, history tools and weather interpretation are built specifically for Open Sky LIVE.
Moving Forward
This is the last big update for some time, the next update will start development in July and will push Open Sky LIVE forecasting.
For the last five months, the SkyBox weather station has been quietly collecting local readings. That data is now becoming one of the most important parts of the project. Instead of only showing live weather, Open Sky LIVE will begin using its own local history to improve short-range predictions.
The aim is not to replace national weather models. Open Sky LIVE is not trying to become the Met Office. The goal is to build a hyper-local prediction layer that understands how Gants Hill and the surrounding area behaves compared with wider forecast data.
This means future versions of Open Sky LIVE will start looking at questions such as:
-
does this location usually run warmer or cooler than the public forecast?
-
how quickly does pressure normally fall before rain nearby?
-
do certain wind directions bring faster temperature changes?
-
how often do similar days lead to rain, gusts, frost or clearer conditions?
-
when should confidence be high, and when should the forecast admit uncertainty?
One of the planned systems is a local forecasting layer currently being explored under the idea of OSL LocalBoost.
LocalBoost would compare three things:
-
live SkyBox readings
-
public model data
-
previous local weather patterns
From this, Open Sky LIVE could produce a corrected local forecast, showing not just a prediction, but also a reason behind it.
For example, rather than only saying:
27°C expected later today
Open Sky LIVE could eventually say:
The public model suggests 27°C, but similar sunny days at this station have usually finished around 1–2°C warmer. OSL is adjusting the local forecast upward with medium confidence.
Another major part of the next phase will be forecast confidence. Weather prediction is never perfect, especially at a very local scale. Instead of pretending every prediction is certain, Open Sky LIVE will aim to show how confident it is and why.
Future forecast cards may include:
-
corrected local temperature predictions
-
rain risk based on local history
-
gust risk for the next few hours
-
similar-day comparisons
-
confidence scores
-
plain-English explanations
-
warnings when data is uncertain or limited
There is also work planned around bringing in nearby weather station data. If suitable local stations are available, they can act as reference points alongside SkyBox. This could help Open Sky LIVE understand whether a change is happening only at one location, or across the wider area.
The long-term idea is for Open Sky LIVE to become more than a dashboard. It should become a local weather intelligence system: one that learns from its own area, explains what is happening, and gives users a clearer idea of what may happen next.
The API system now also supports multiple SkyBoxes so a cheap fleet creation is in the works